Data-Driven Leadership
Project Overview
CLIENT / CONTEXTExecutive learning program (portfolio project)
ROLEInstructional Designer (Full-cycle)
DURATION~45 minutes
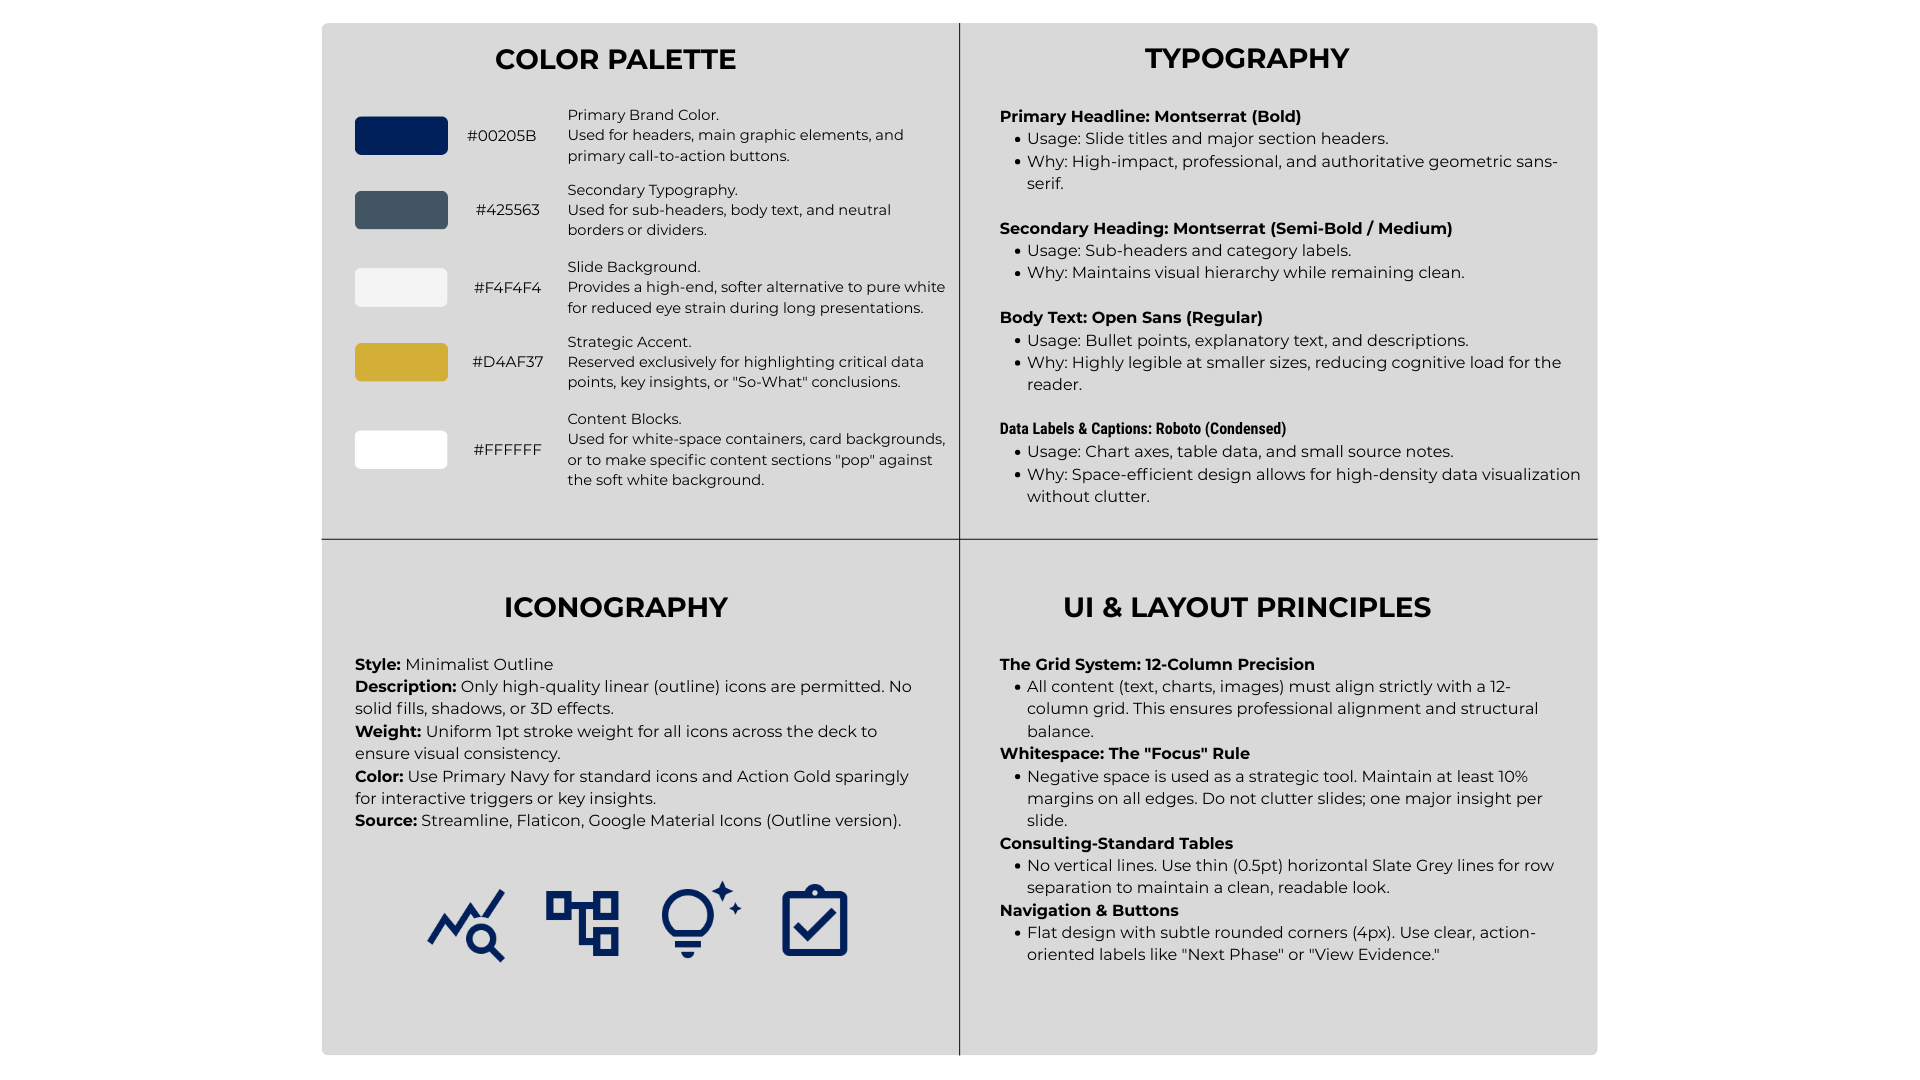
FORMATProfessional Presentation (PowerPoint)
Key Outcomes
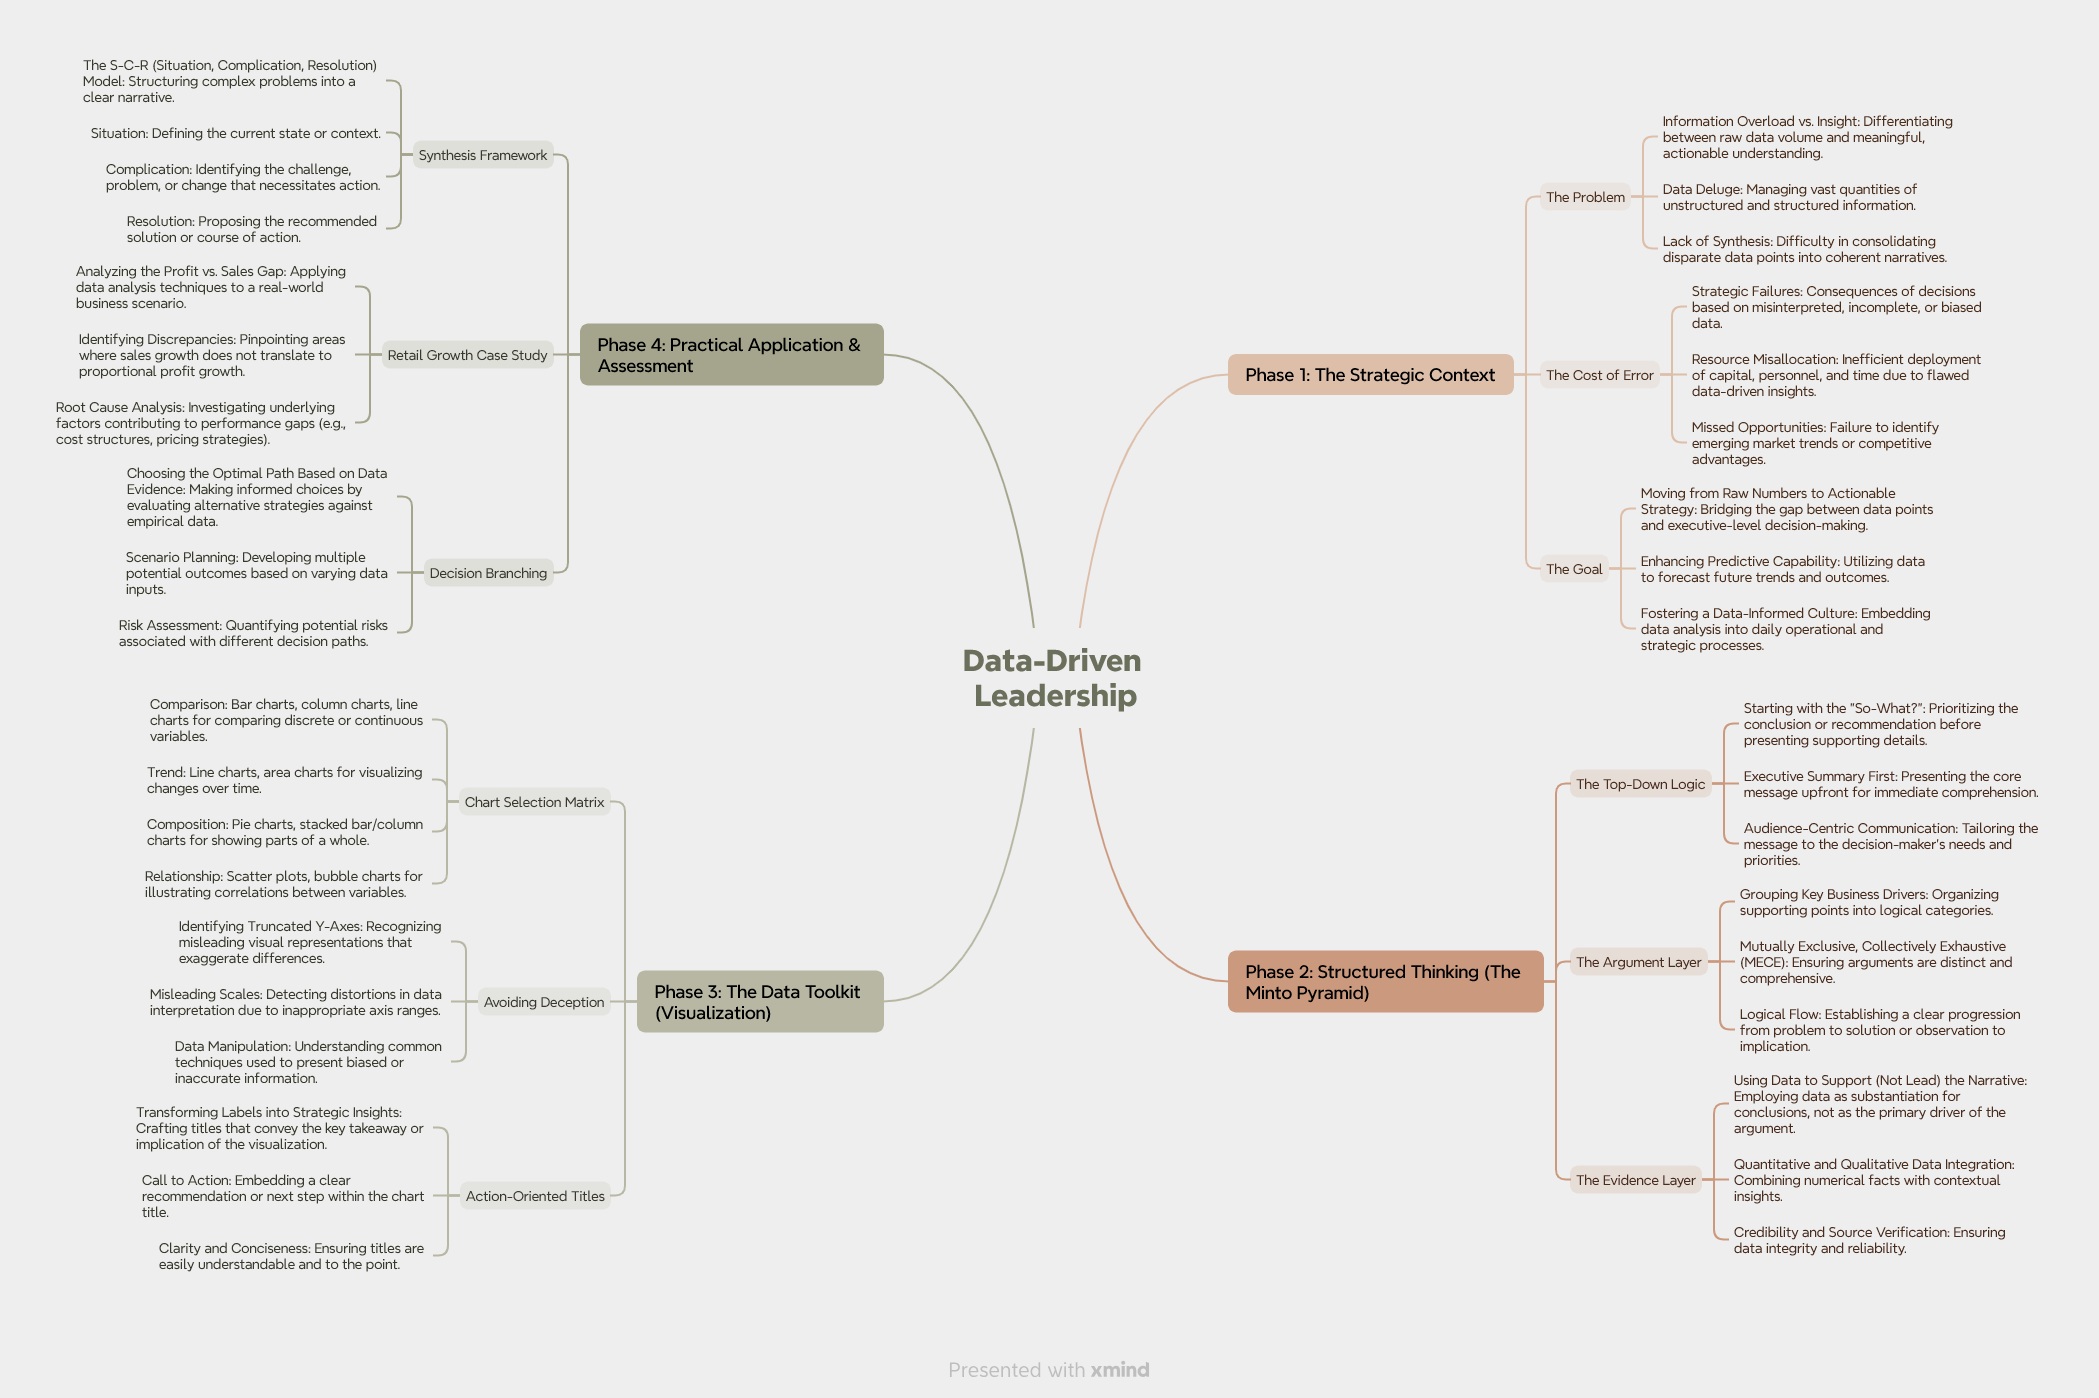
- Distinguish between correlation and causality before making strategic decisions
- Structure data arguments using the Minto Pyramid — conclusion first, evidence second
- Select the right chart type based on the specific business insight being communicated
- Identify manipulated visuals and misleading data representations
- Rewrite descriptive slide titles into action-oriented, insight-driven headers
- Synthesize raw data into a clear executive narrative for stakeholder reporting